


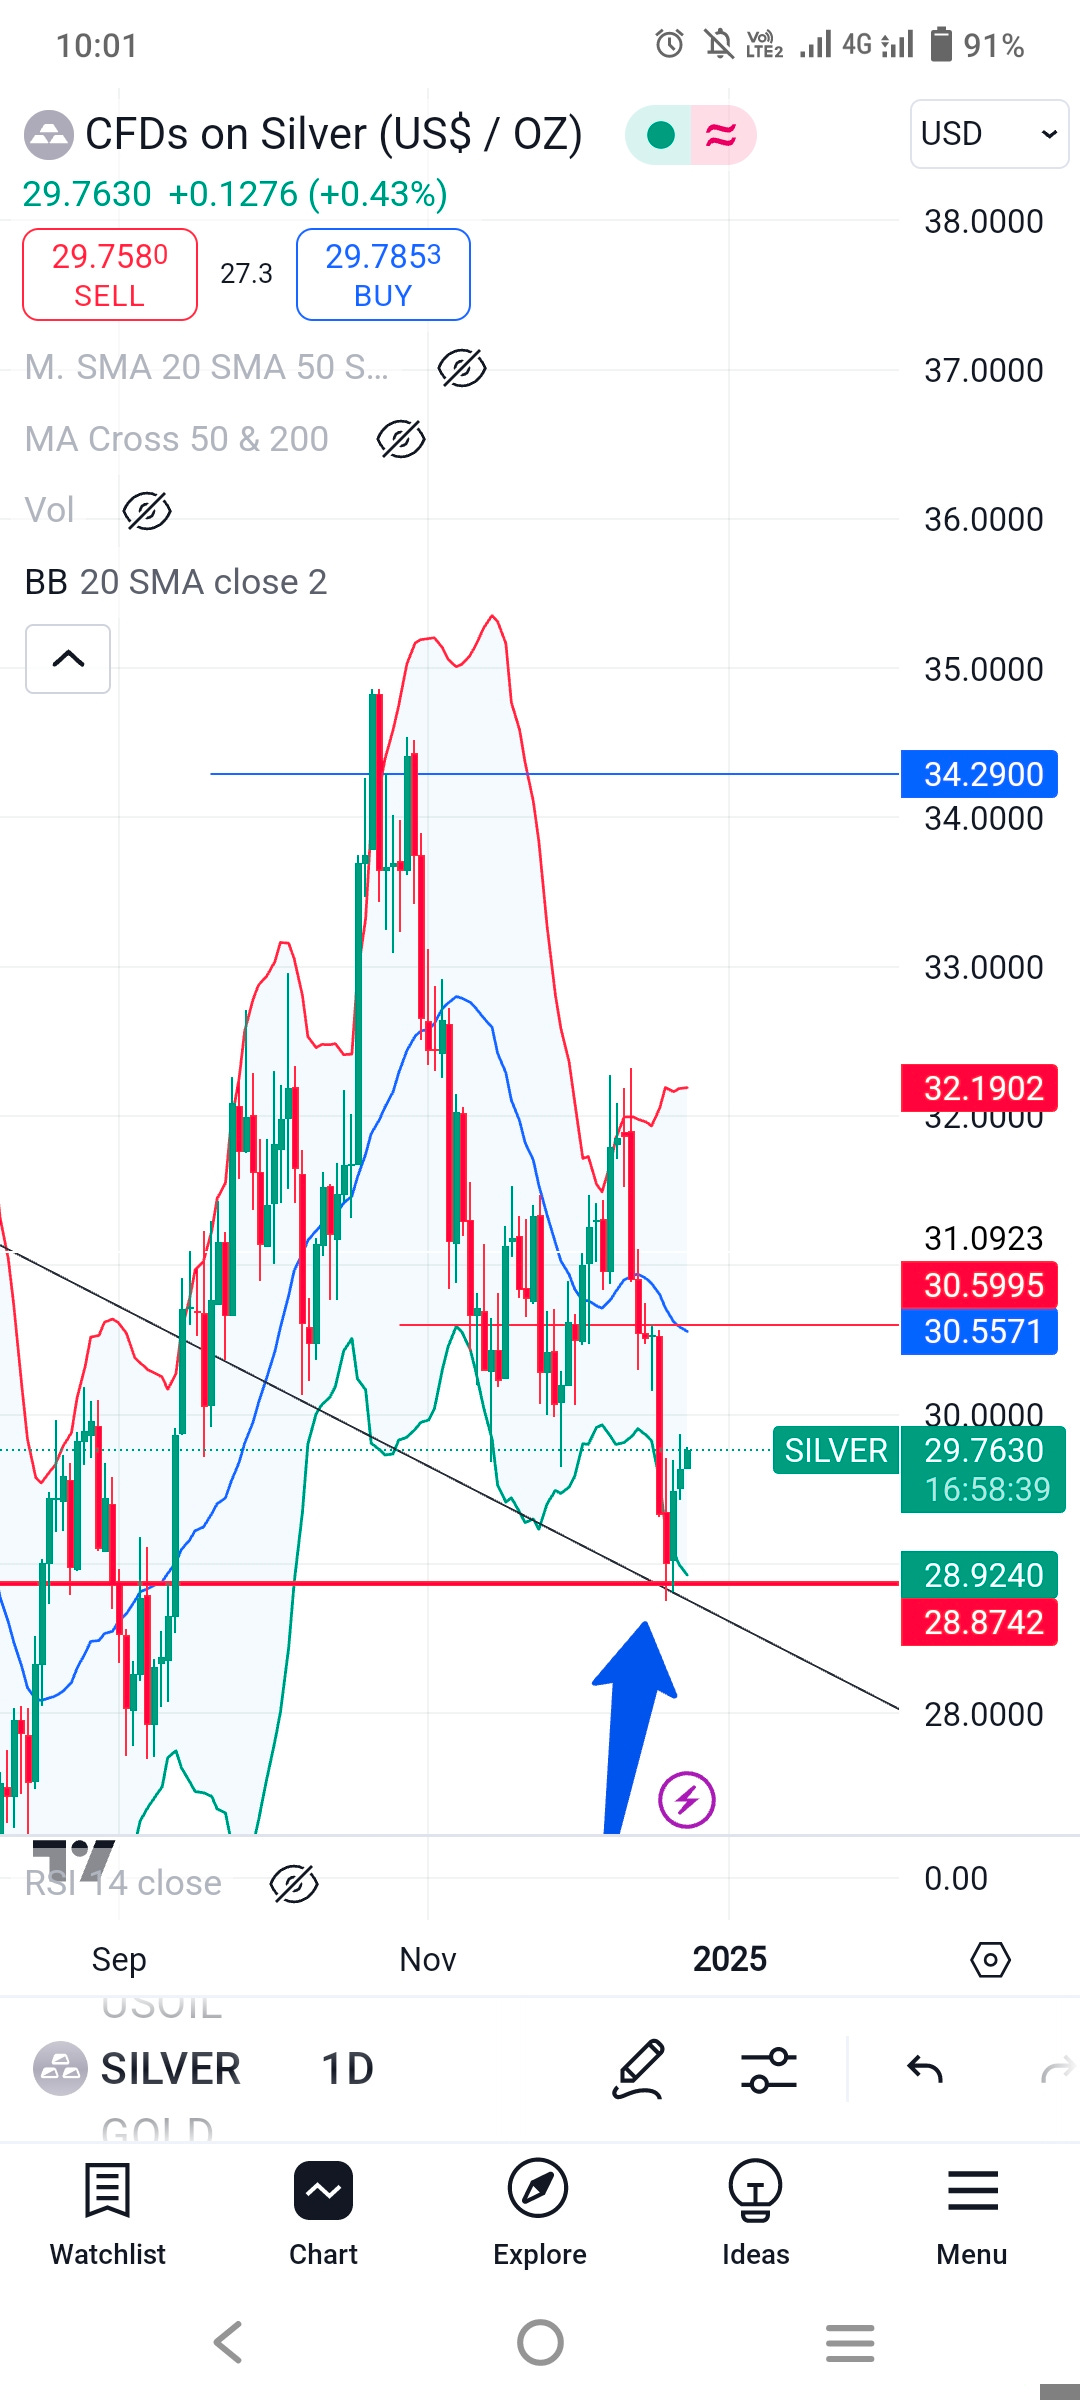
Silver Lining in Silver

Silver low date was December 20 and if we look at the price action it is gaining momentum for the next high of this rally.
I was expecting the price to tap to that level and had shared the chart in chat for a month ago so for me the low is in..Yes some pull backs to 29.200-100 possible but after Christmas it should take off.
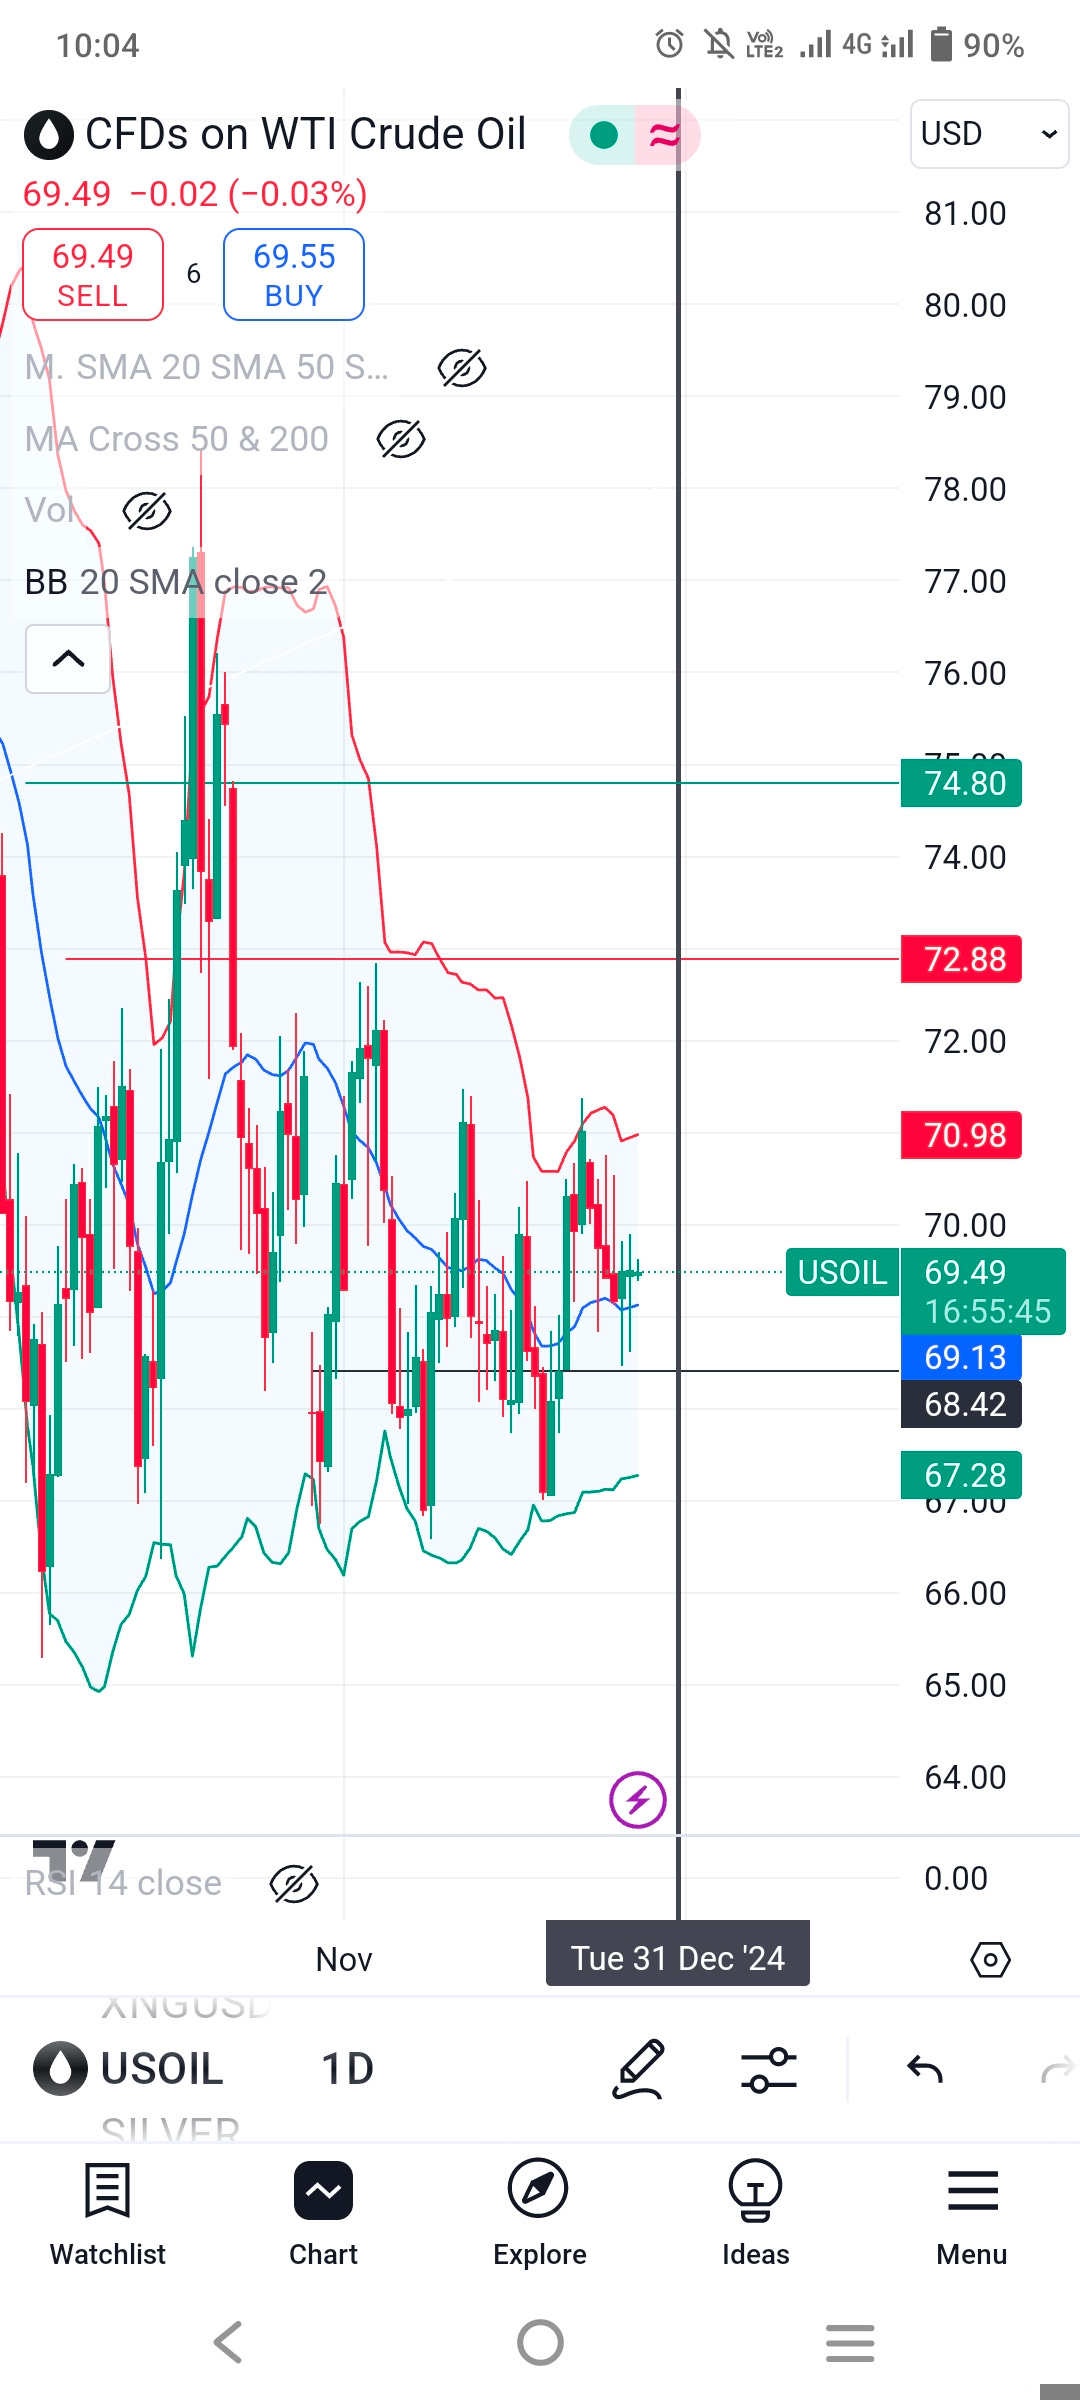
Oil had December 06 the intermediate term low and now I'm expecting it to top near the first week of January..The price action is nearly confirming the upward move.. Even a 15 minute candle closing below to 68.30 level or this black line will invalidate this set up..
First target is expected near 72.88 and then 74.50 then may be a sell off.
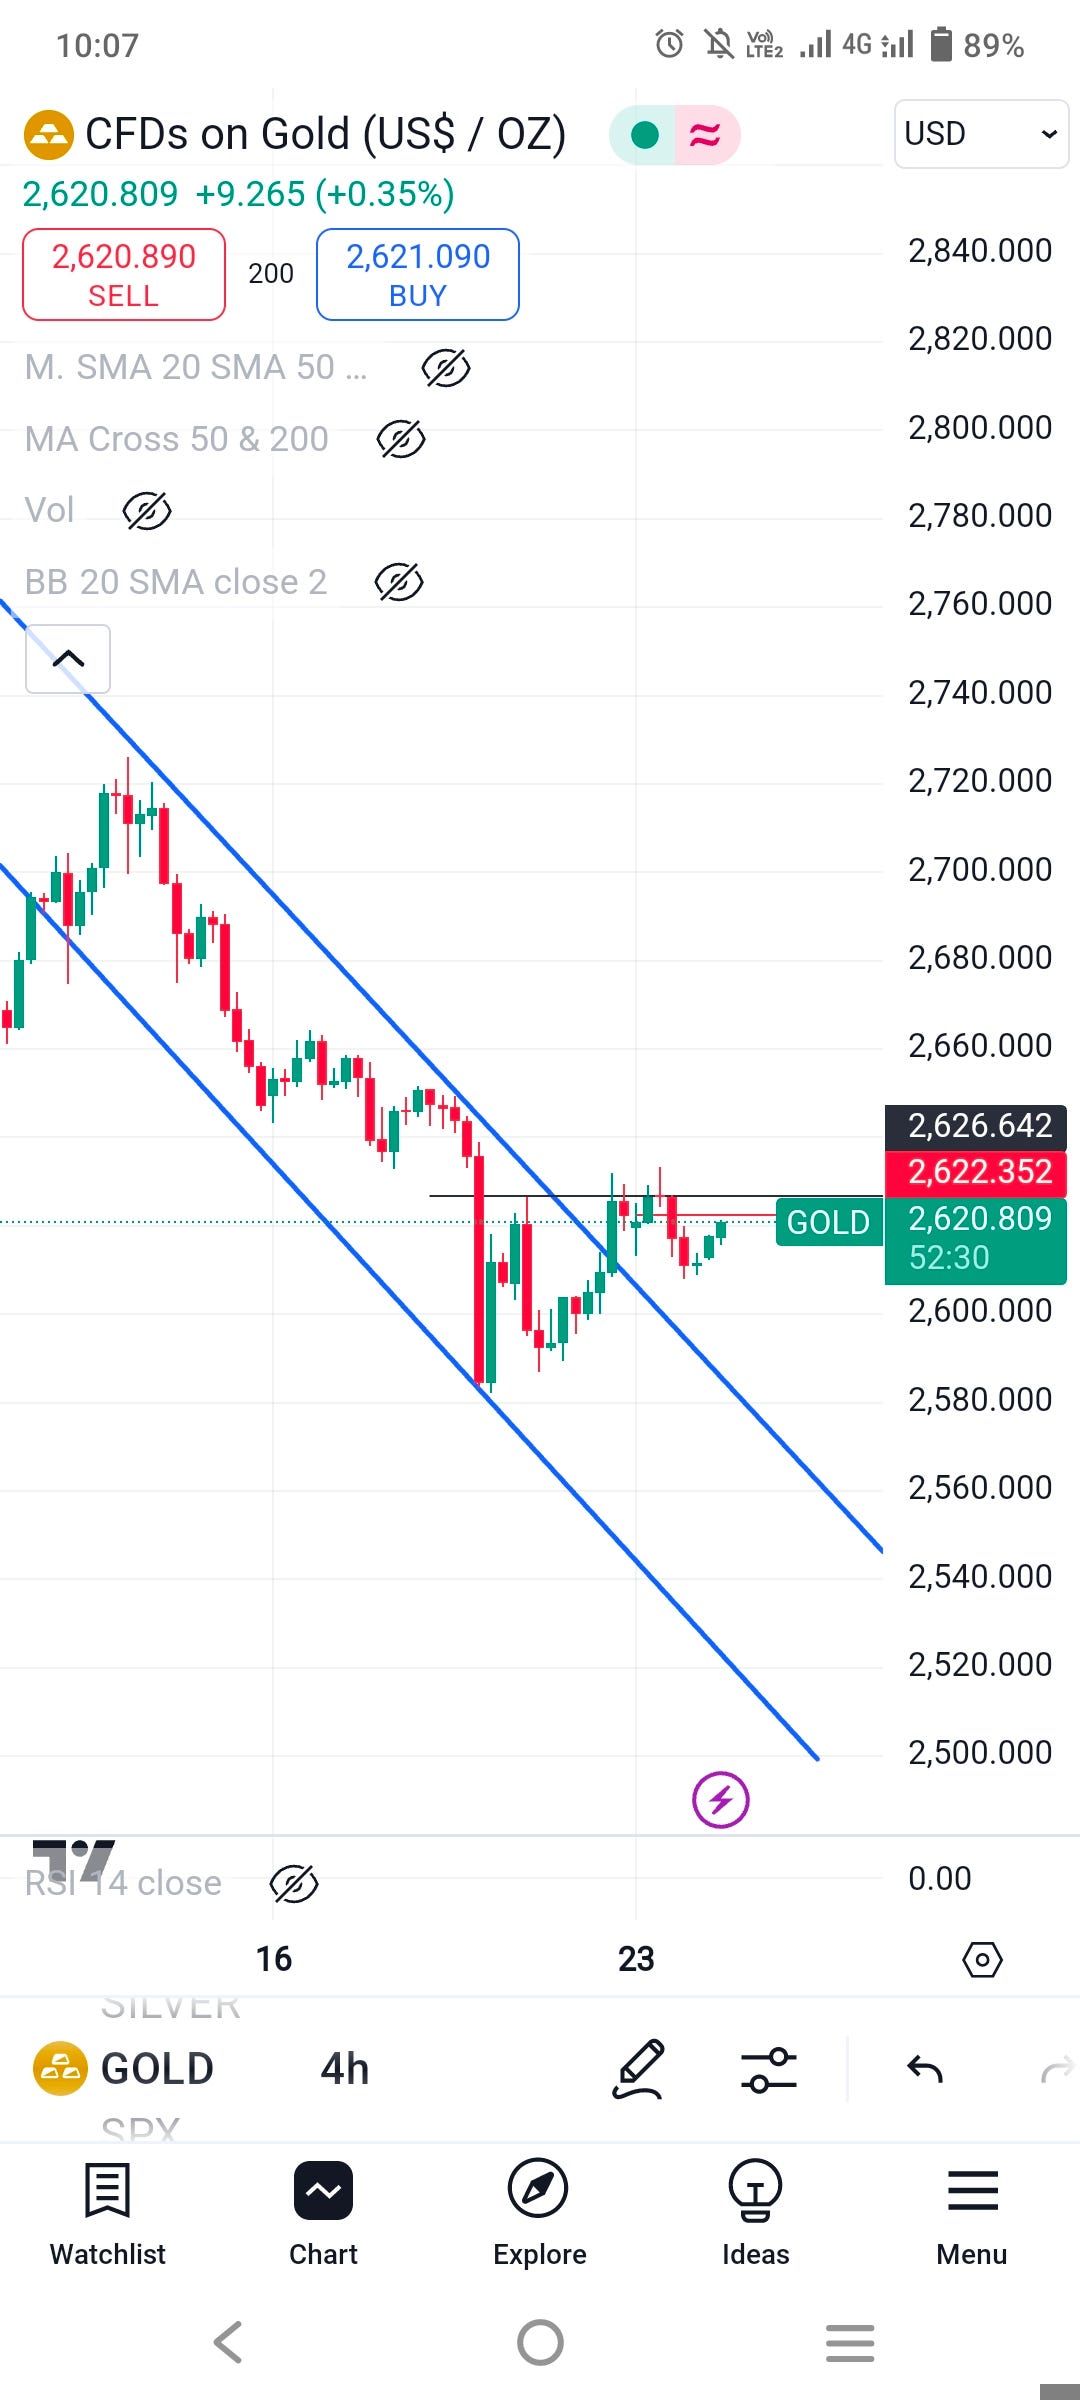
Gold on the price action side is trading outside the trend line, printed an intermediate term low with silver apparently a higher to the previous one of 2536 and is forming the candles of momentum shift.
15 min candle closing above to 2633 will negate the possibility of lower levels like 2600-2604 to tap again and start of a new rally for a new ATH.
But I still believe it may come to these levels and then up..
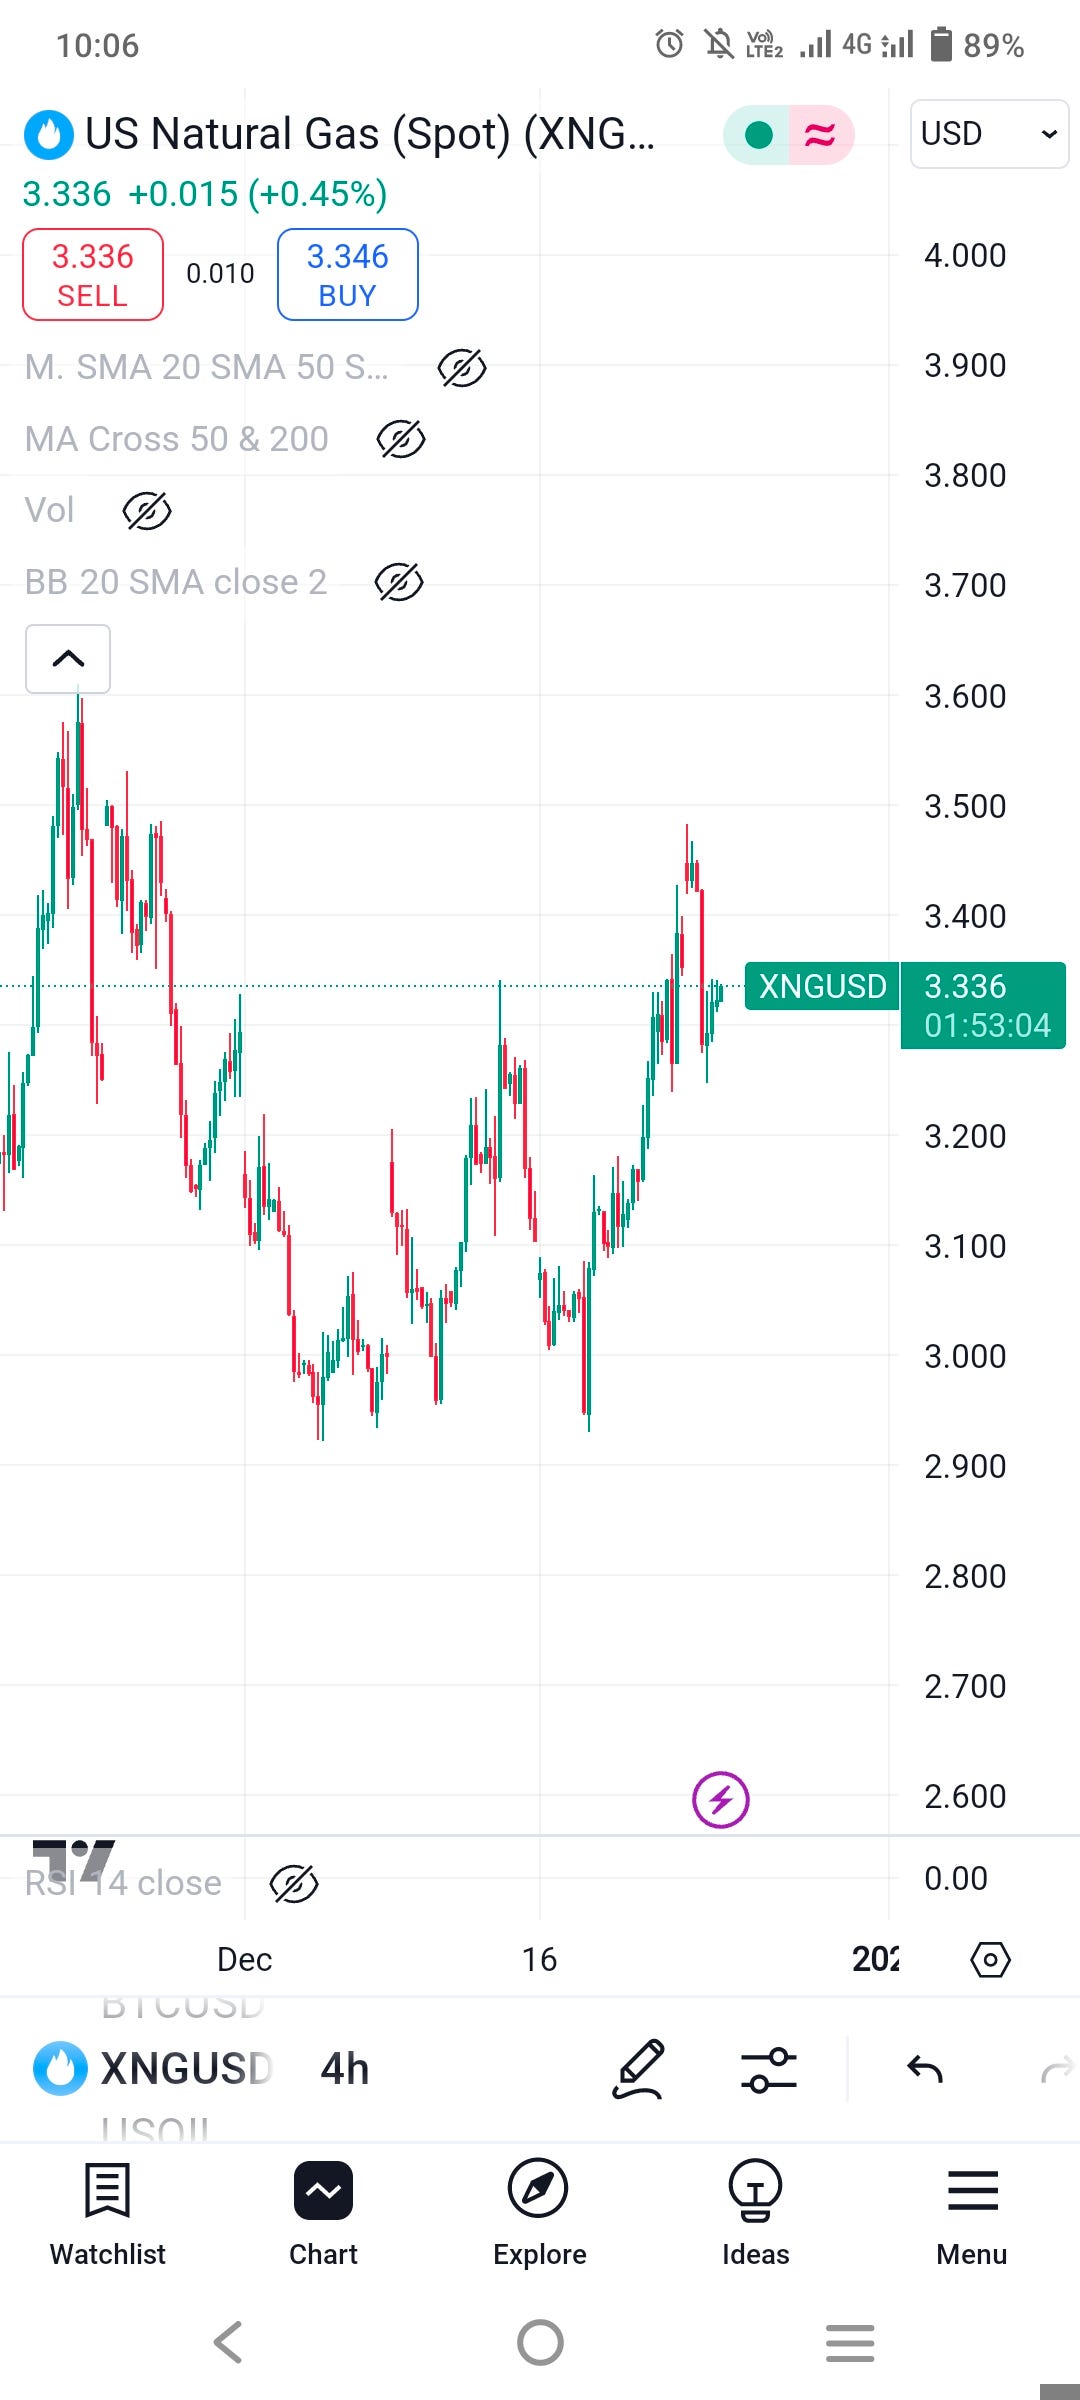
Natural gas is clearly in a bullish momentum and I prefer this for a swing trade. If we look at the 4H chart it is farming a cup like pattern.. so me some 2 to 3 weeks more required to break resistance of 3.60 level because with the completion of cup and then its handle would require some time..
If you want to take a trade it has a solid support area of 3-3.10 where you can open your longs if the price comes again to that level
Otherwise on the breakout you can take your ride.
Hello, how long should we hold the longs for Silver? When will the top occur and what level? Thanks.